FusionCharts – Charting just Got Stylish
Have you been looking to create rich reports for your project but tired of the same old and dull look of the project and charts? A project can look a lot interesting if there were unique and good-looking charts available, right? If you are tired of plain looks and same old chart types, you should check out FusionCharts.
Do you remember those days when charts were all about lines and they came across as utterly boring? Of course you do, but thanks to the FusionCharts, we can now have JavaScript charts, interactive charts and the best thing is, we can have animated charts as well. Let us take a look as to what FusionCharts has to offer us.

Product Info – Enchanting JavaScript for Mobile and Web apps:
Are you looking for some serious JavaScript charting for your mobile and web applications? If yes, FusionCharts is the best option for you. The best thing about FusionCharts is that it supports all devices and all browsers, which includes all versions of Internet Explorer (6, 7 and 8). You will get to experience unified browsing, which is the best thing.
Set-up in 15 minutes:
Installation does not get any easier as it offers you copy-paste installation. Also, FusionCharts offers numerous demos and extensive documents in order to provide you with guidelines, They are easy to understand and if followed properly, you can create your first chart in just 15 minutes. Once created, you can then add other capabilities.
Demos:
You will get FusionCharts Suite XT Business Demos for your inspiration and to your surprise; there is a wide range of demos available for your help.
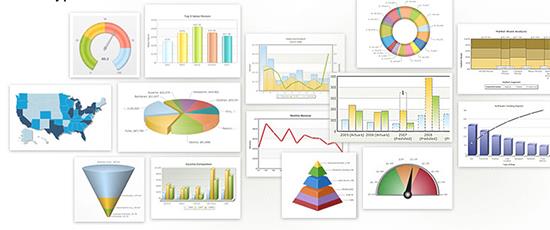
Chart Gallery:
Thanks to the comprehensive charting library offered by FusionCharts, you no longer have to adjust with a column chart if you are looking for a funnel chart. We all know how important correct chart types are because wrong chart types will eventually result into wrong analysis. With FusionCharts Suite XT you will get 90+chart types and 950+maps. You can find column * Bar charts, Pie & Doughnut charts, Stacked charts and a lot more.
Free Trial:
All you need to do is fill a simple form and download a free trial of FusionCharts Suite XT consisting of FusionCharts XT, FusionWidgets XT, FusionMaps XT and PowerCharts XT and a lot of other products.
jQuery charting plugin:

With FusionCharts jQuery chartin plugin, you can add interactive JavaScript charts and graphs in your web or mobile applications. In order to create a simple chart with the help of jQuery plugin will require you to follow 4 simple steps.
You can also create a chart with multiple data series, create gauges or widgets for dashboards, add drill-down to charts and use HTML tables as a data source.
Technical Support:
You no longer have to spend hours on getting your query answered. With technical support provided by FusionCharts, you get personalized support and that too within 24 hours if you have opted for support subscription.
Comparison of JavaScript/HTML5 Charting Libraries in the market:
I know that choosing a charting component is not at all an easy task because a lot needs to be considered before selecting one. FusionCharts makes things a lot easier for everyone by providing a comparison of JavaScript/HTML5 Charting Libraries in the market. This will definitely help you in making a decision. For comparison, view the following link:
http://www.fusioncharts.com/javascript-charting-comparison/
Added Benefits:
Apart from all the stuff mentioned above, you get following advantages of using FusionCharts:
– Fusion Widgets
– Power Charts
– Fusion Maps
Conclusion:
Enough said, I would highly recommend you have to try this on your own and feel the advantages yourself.


